
Eight things this data shows
Recognition programs have always run on belief. This report runs on behavior: millions of recognition moments across thousands of active teams and 76,000+ members, measured over the trailing twelve months of Matter platform data.
1. Recognition is peer powered. Across more than 92,000 org-chart-verified recognition events, 4 in 5 flow peer to peer, and 77% of reward coins are earned through peer kudos.
2. Every industry has a signature. Agencies recognize most intensely, technology is the most peer driven, nonprofits write the longest thank-you's, manufacturing attaches the most rewards.
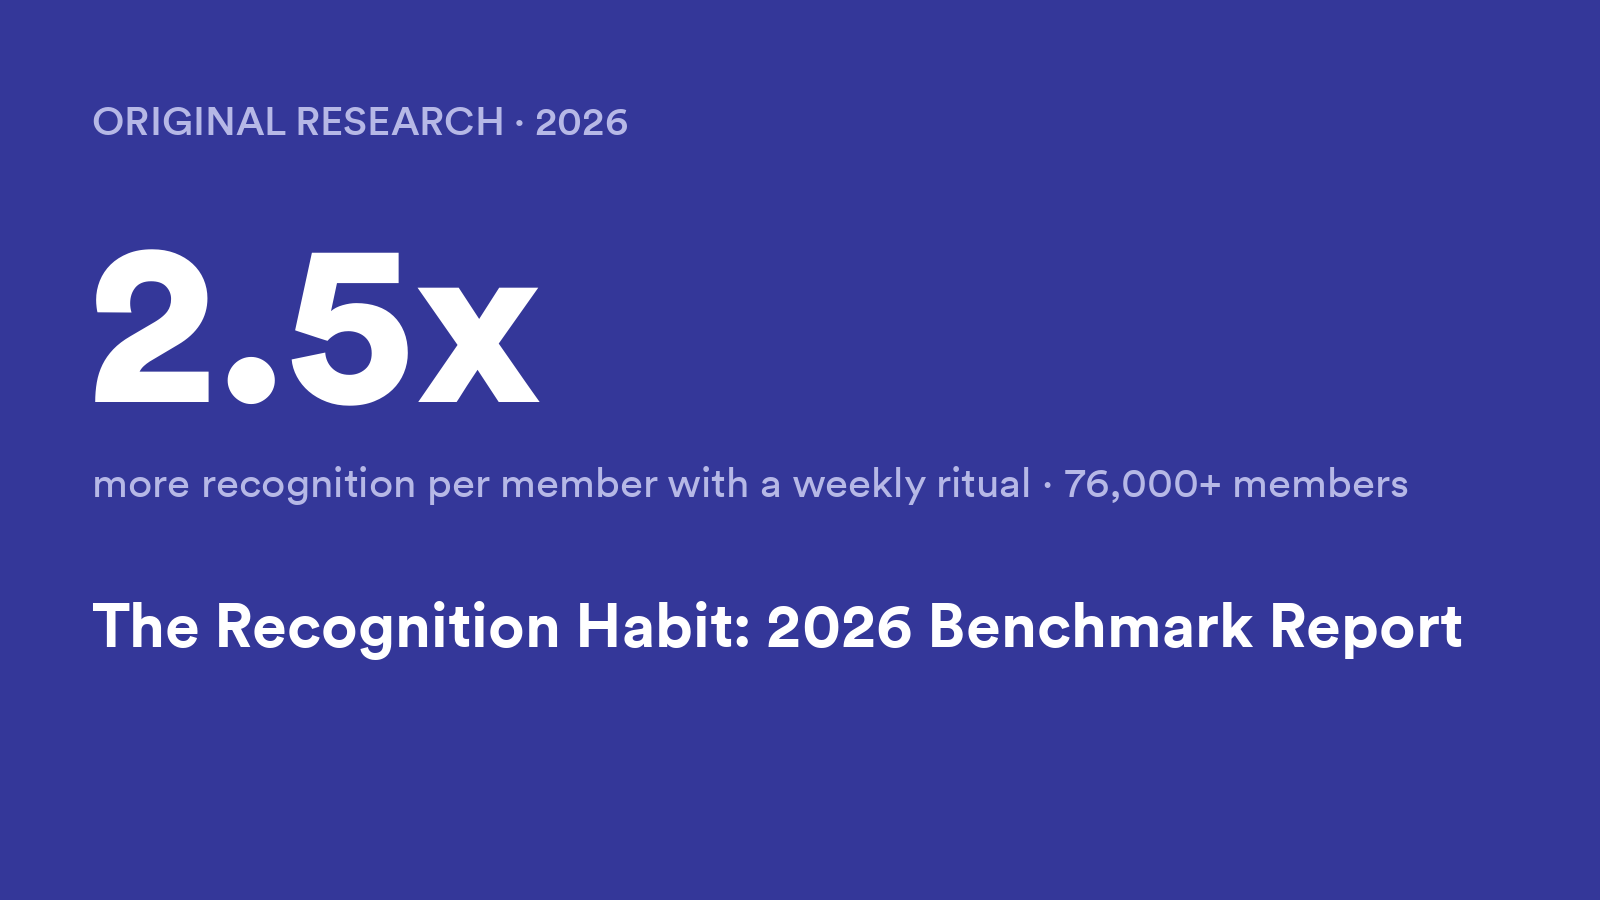
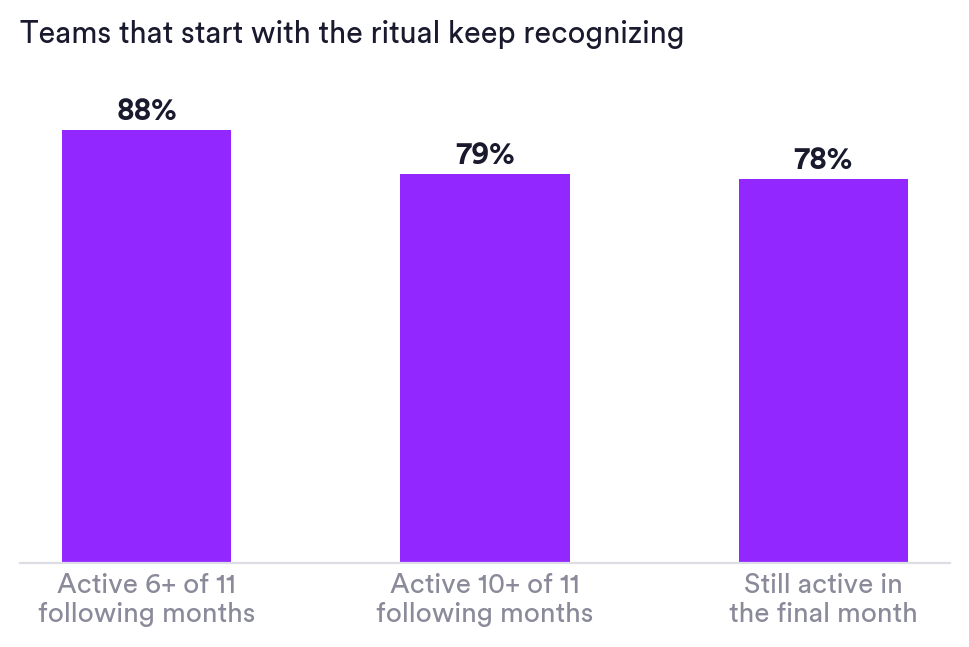
3. A weekly ritual builds the habit. Teams that build recognition around a weekly ritual give about one recognition per member every month; ad hoc teams, about one every two and a half months. That is 2.5x, outliers excluded, and roughly 8 in 10 ritual teams stay active in nearly every month.
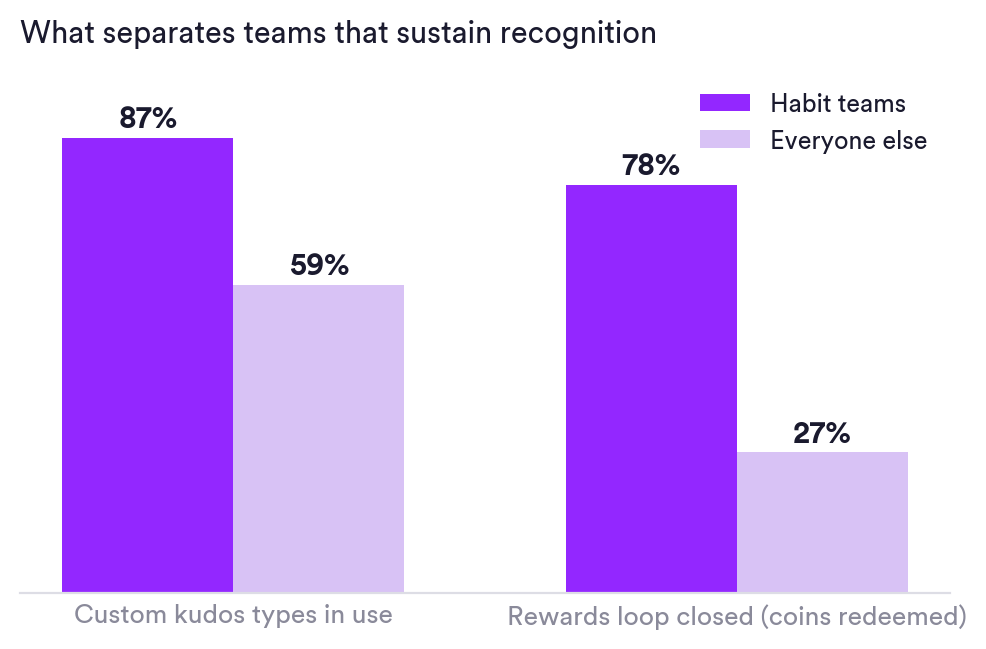
4. The success pattern is learnable. Habit teams make recognition their own with custom kudos such as company values (87% vs 59%), close the rewards loop (78% vs 27% redeem), and listen twice as often with pulse surveys.
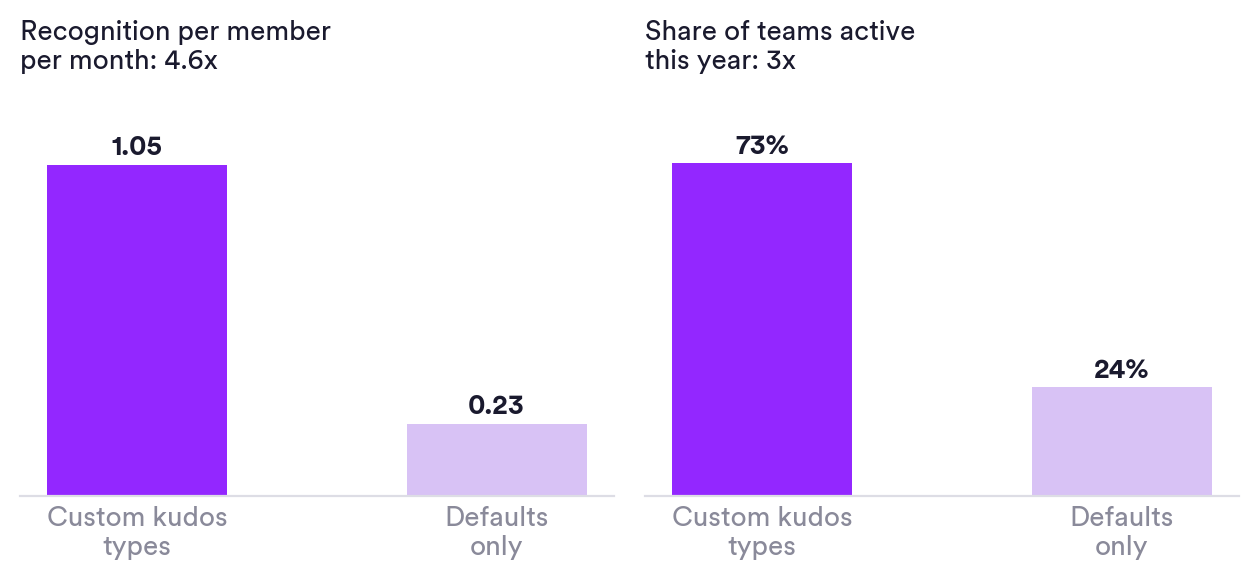
5. Recognition sticks when it speaks the team's language. Teams that build their own kudos types recognize 4.6x more per person, and where custom types exist, 65% of recognition uses them.
6. The effect holds at scale. Ritual teams from 50 to 1,000 seats sustain recognition at essentially small-team rates.
7. The supporting habits stick. 95% of teams run celebrations with 97% of the data self-served, rewards stay small and frequent at a $30 median, and 90% of challenge claims get approved.
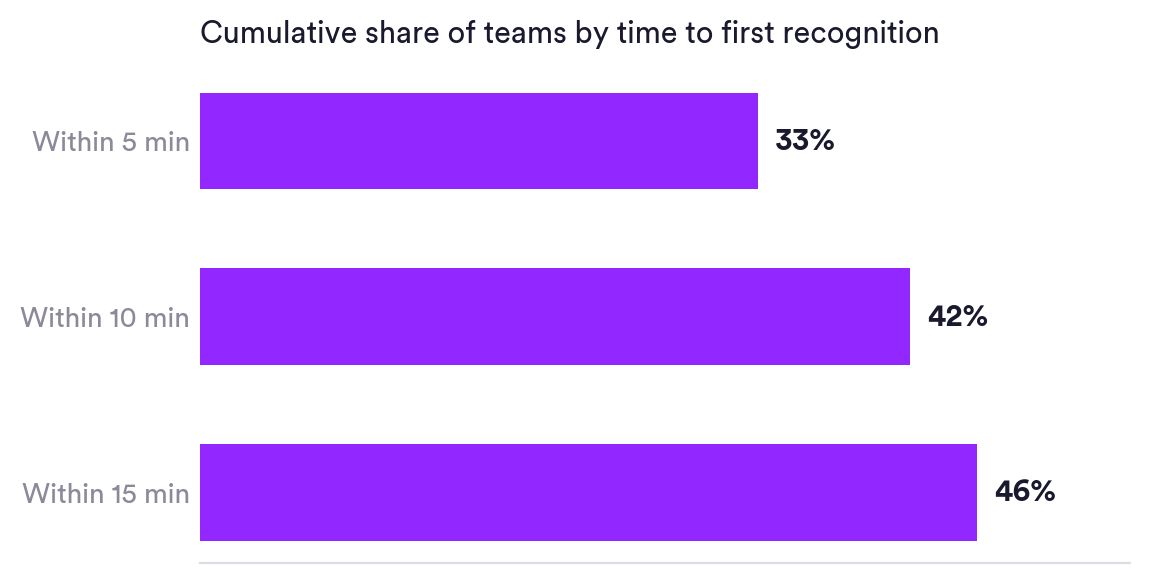
8. Time to value is nearly immediate. Almost 50% of teams send their first recognition within 15 minutes of setup; one in three within 5.
Recognition is peer powered
We held recognition to a strict standard: both the giver and the receiver verified in the organization's reporting structure. Across more than 92,000 recognition events that clear that bar, 80.9% flow peer to peer. Manager-to-report is 12.9%, report-to-manager 6.1%. The pattern holds economically too: 77.4% of all reward coins are earned through peer kudos.
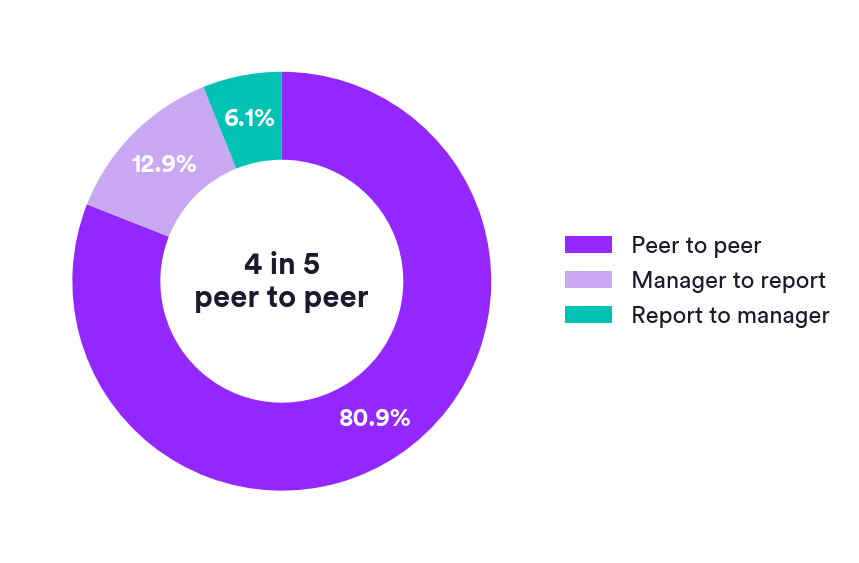
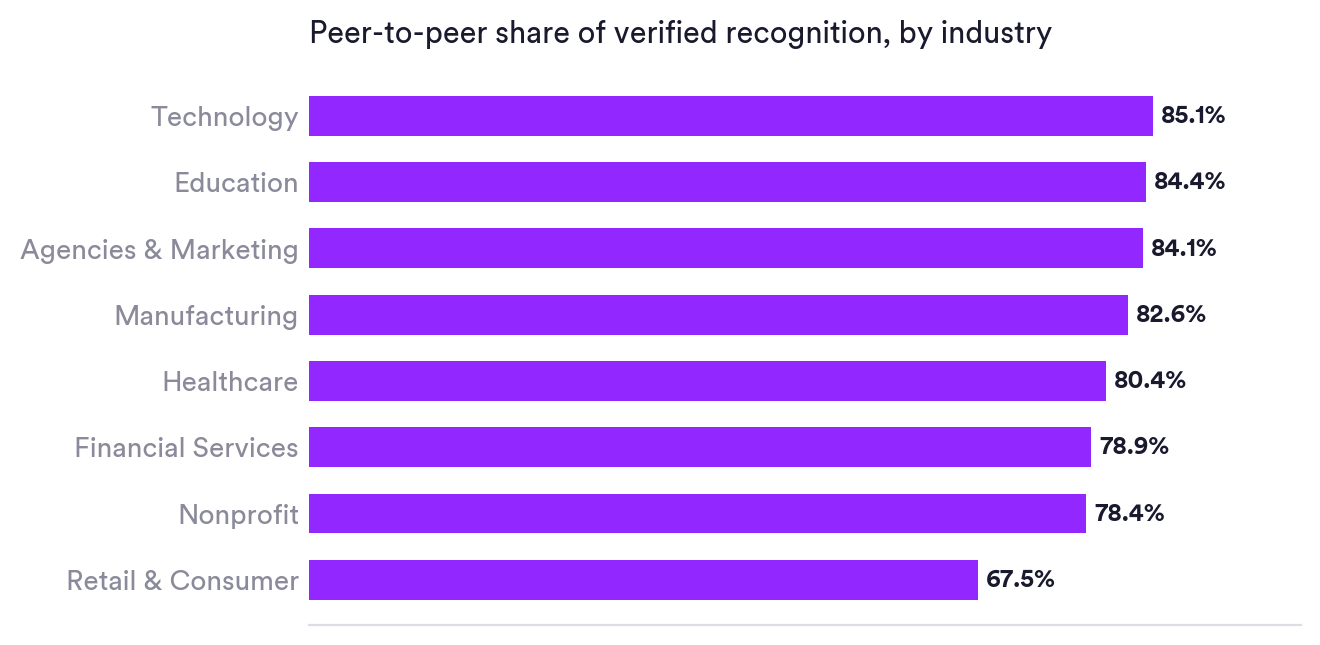
Every industry is majority peer, from technology at 85% to retail at 68%. The design implication is blunt: programs built around manager approval are built around one fifth of the activity.
A weekly ritual builds the habit
To measure what a ritual is worth, we followed a cohort: every team recognizing in its first measured month, classified by whether that early recognition ran through ritual channels, then tracked across the following eleven months. On Matter, the weekly ritual is Feedback Friday™, enabled from day one with no configuration required.
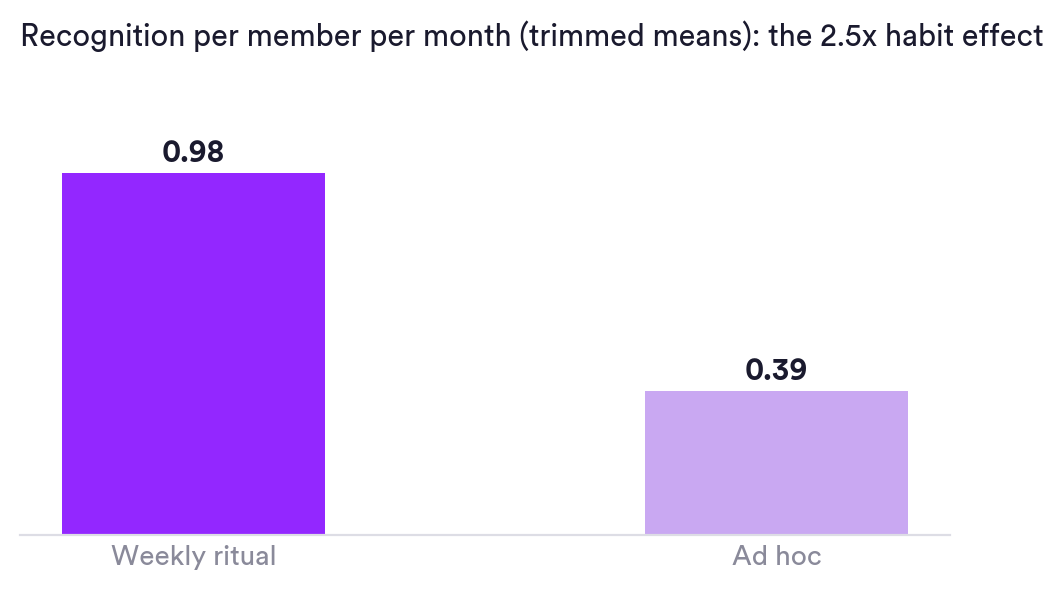
With the ritual, the average member gives about one recognition every month. Without it, about one every two and a half months. That is a 2.5x difference, and it compounds: roughly 8 in 10 ritual teams are still recognizing in nearly every month of the year. The mechanism is visible in the calendar: ritual channels concentrate 5.4x a typical weekday's recognition on Fridays, against 1.8x without, in every industry and country we measured.
The success formula
We defined success strictly: teams consistently active across the year with above-median recognition per member. Four habits separate them.
Build recognition around a weekly ritual. Ritual teams recognize 2.5x more per person on average.
Make recognition their own. 87% of habit teams use custom kudos types, against 59% of everyone else.
Close the rewards loop. 78% of habit teams see earned coins actually redeemed, against 27%. The biggest gap we found.
Listen while they recognize. Habit teams are twice as likely to run pulse surveys.
Just as telling is what does not separate them: celebrations run at roughly 93% everywhere, and public visibility sits near 88% for everyone. Those are table stakes.
Make it your own
Teams that create their own kudos types, for example around company values, recognize 4.6x more per person on average than active teams that stick to defaults, and are 3x more likely to be active at all. Where custom types exist, 65% of recognition uses one. Customizing takes minutes, and it is worth the setup investment.
What great recognition looks like
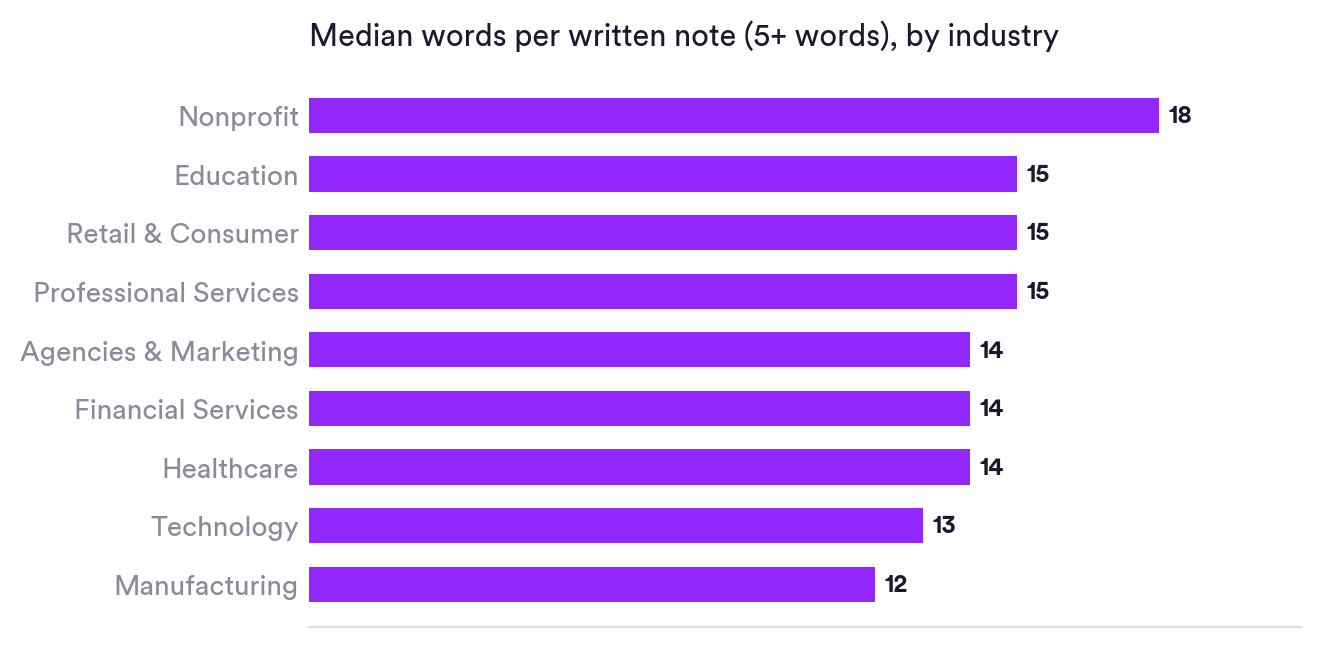
Among written notes of five words or more, the median runs 14 words and the average nearly 19. Nonprofits write the longest thank-yous at an 18-word median.
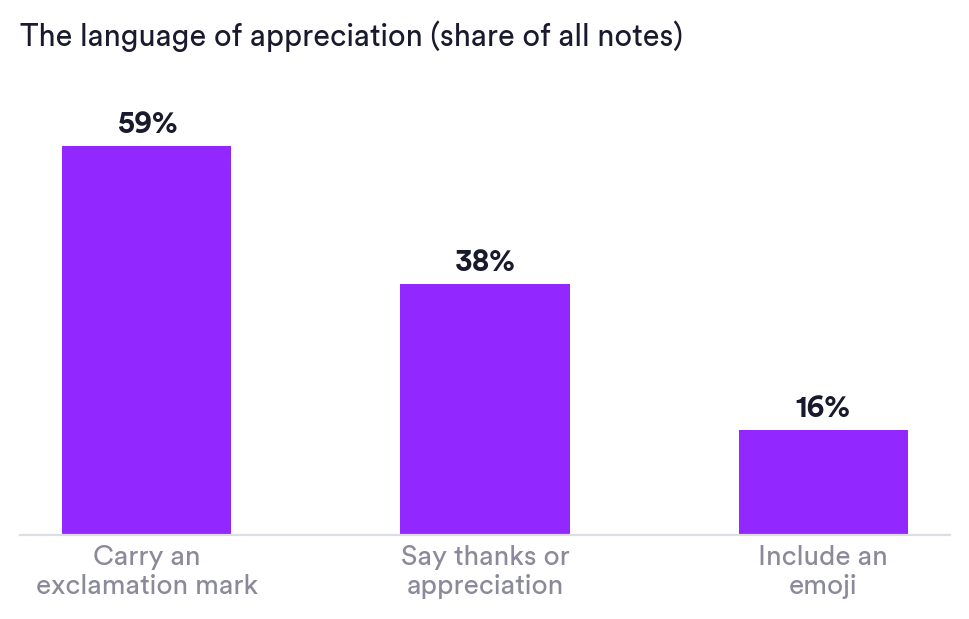
The language of appreciation is exuberant: 59% of notes carry an exclamation mark, nearly four in ten say thanks outright, and one in six includes an emoji.
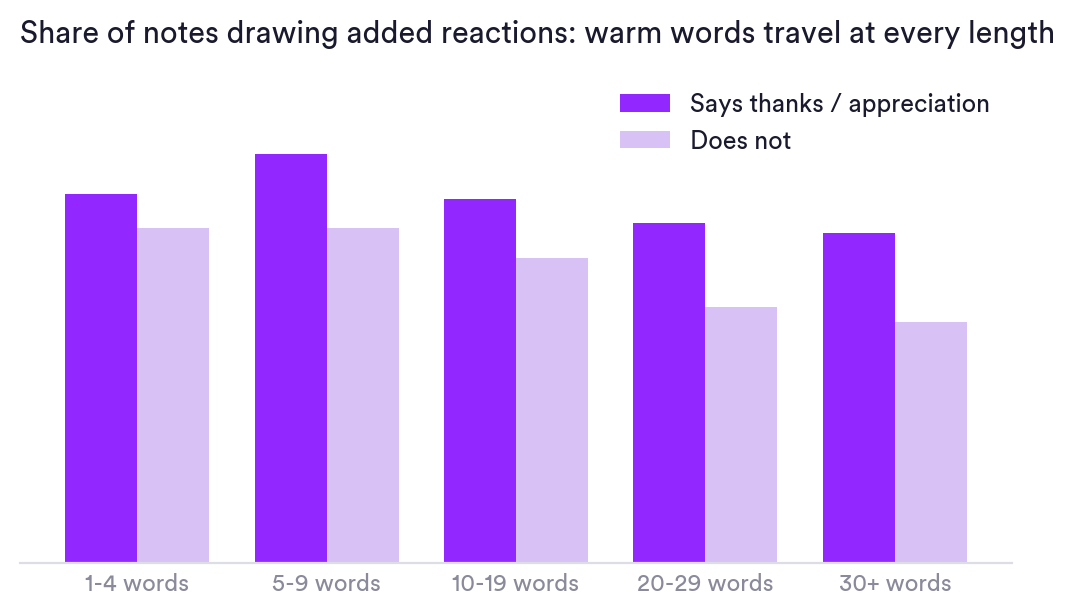
And warmth pays: notes that include words of thanks draw roughly 20% more added reactions from colleagues, at every length we measured.
Benchmarks by industry
Every industry has a recognition signature. Each line is a benchmark a team can compare itself against.
- Agencies & Marketing: most frequent recognition (0.97 per member per month) and most public (94%)
- Education: strongest Friday ritual (8.1x lift); birthdays on everywhere
- Financial Services: among the leaders in custom kudos usage (70% of recognition tagged to a custom type)
- Healthcare & Life Sciences: steadiest week; recognition follows shift schedules, not office days
- Manufacturing & Industrial: most likely to attach rewards (89% of kudos carry coins)
- Nonprofit: most thoughtful (longest notes, 18-word median)
- Professional Services: most selective about visibility (lowest public share)
- Retail & Consumer: rewards close behind (88%); among the strongest Friday lifts (7.7x)
- Technology: most peer driven (85% of verified events)
Recognition at scale: structure beats size
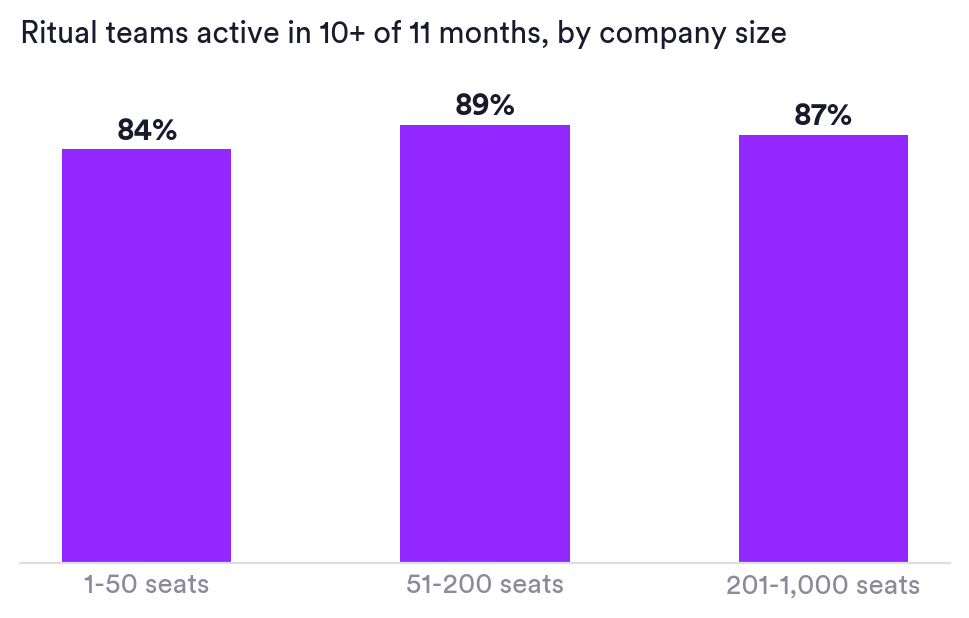
Recognition intensity naturally fades as headcount grows; proximity does for small teams what structure must do for large ones. The ritual is that structure. Among ritual-cohort teams, 84% of 1-to-50-seat teams were active in ten or more of the eleven months we tracked. At 51 to 200 seats: 89%. At 201 to 1,000 seats: 87%. Essentially small-team staying power, at ten to twenty times the headcount.
Celebrations and rewards that land
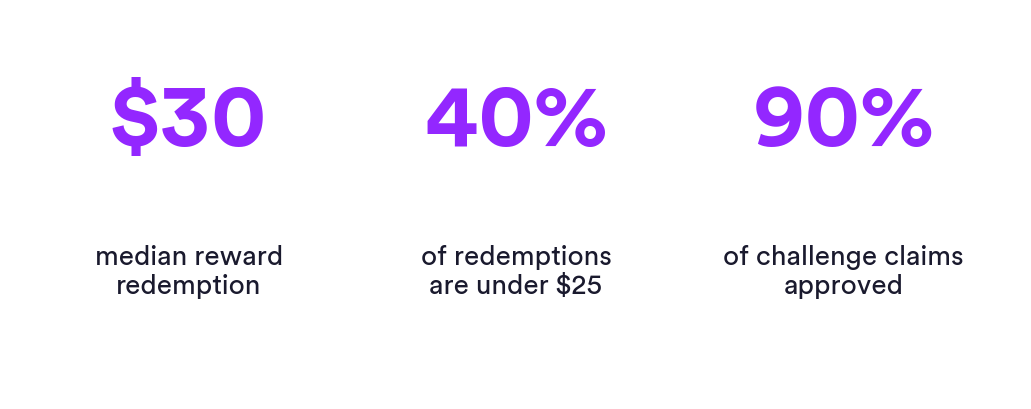
Celebrations are near-universal: 95% of teams run automated birthday and work-anniversary celebrations, and 97% of the underlying dates are added by teams themselves. No HRIS integration, no admin data project. Rewards stay human-sized: the median redemption is $30, and 40% land under $25. Challenges, where teams reward specific actions, see 90% of claims approved. Small and frequent beats large and rare.
The listening layer
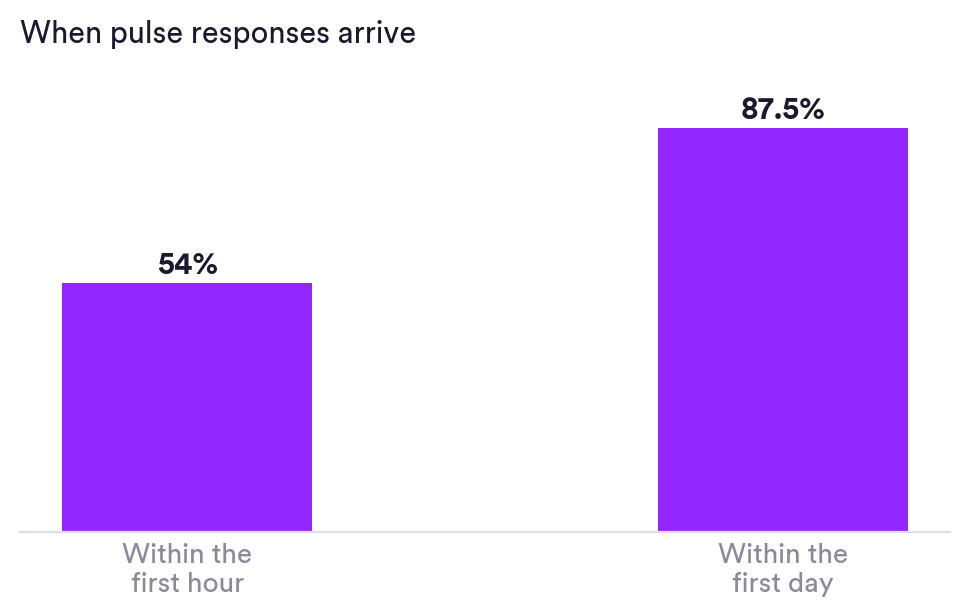
Chat-native surveys get answered the same day, not next week or a month later: over half of pulse responses arrive within the first hour, and 87.5% within a day.
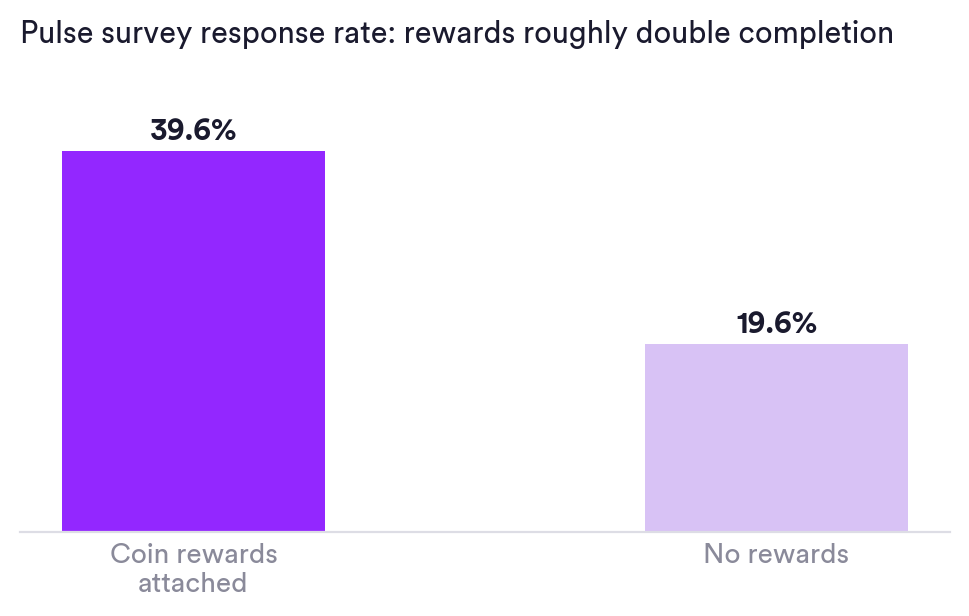
Rewards double the response: pulse surveys with coin rewards attached see roughly twice the completion rate, measured across 84,000+ pulse surveys.
And 98.2% of pulse surveys run anonymous, which is what makes an honest baseline possible.
Benchmarks you can cite
- Teams with a weekly recognition ritual give 2.5x more recognition per member (trimmed means, eleven-month cohort)
- 4 in 5 verified recognitions flow peer to peer (more than 92,000 org-chart-verified events)
- 77% of reward coins are earned through peer kudos
- Teams with custom kudos types recognize 4.6x more per person
- 95% of teams run automated celebrations; 97% of the data is self-served
- Median reward redemption is $30; 40% of redemptions are under $25
- Pulse surveys with coin rewards see roughly 2x the completion rate
- Over half of pulse responses arrive within the first hour
Cite as: Matter, The Recognition Habit: 2026 Benchmark Report.
Frequently asked questions
How much more recognition do teams give with a weekly ritual?
About 2.5x more per member. Teams whose first-month recognition ran through ritual channels averaged about one recognition per member every month over the following eleven months; ad hoc teams averaged about one every two and a half months (trimmed means, outliers excluded).
What share of workplace recognition is peer to peer?
4 in 5. Across more than 92,000 recognition events where both giver and receiver were verified in the org chart, 80.9% flowed peer to peer, and every industry measured was majority peer.
What is a good pulse survey response rate?
On Matter, over half of pulse responses arrive within the first hour and nearly 9 in 10 within a day. Attaching coin rewards roughly doubles completion, measured across 84,000+ pulse surveys.
What do employees actually redeem rewards for?
Small and frequent wins: the median redemption is $30 and 40% of redemptions are under $25.
Which industries recognize the most?
Agencies and marketing teams recognize most frequently (0.97 recognitions per member per month). Technology is the most peer driven (85% of verified events), and education shows the strongest Friday ritual (8.1x lift).
Where does this data come from?
Aggregate, de-identified Matter platform data over the trailing twelve months, covering thousands of active workspaces and 76,000+ members. Full methodology on this page; findings are free to cite with attribution.
Methodology
Findings come from aggregate, de-identified Matter platform data over the trailing twelve months, covering thousands of active workspaces and 76,000+ members. Industry segments draw on a 2,070-workspace enriched subset (nine industries, minimum 30 workspaces per published cell). The ritual cohort classifies teams by first-month behavior rather than current settings, which removes the auto-disable feedback loop; early adoption is self-selected, so figures describe observed differences, not a controlled experiment. Peer-to-peer uses a strict scope: both giver and receiver verified in the organization's reporting structure (92,533 events). Note-language analysis was fully automated over de-identified aggregates; no individual messages were read by humans. Customer names, message text, tenant-level figures, and absolute volume totals are deliberately excluded. Findings are free to cite with attribution and a link to this page.


Get the Full Report (PDF)